


Introduction
Two businesses. Same industry. Same monthly Google Ads budget, wildly different Google Ads conversion rate
- Business A is achieving a 12% conversion rate, leads are coming in, the cost per conversion is low, and the sales team is stretched.
- Business B is at 2.1%, watching spend decline, and assuming the problem is the bid strategy, the keywords, or even Google itself.
Here’s what Business B is almost certainly missing: they have no idea what a good conversion rate actually looks like for their campaign, audience, location, and more. So they’re optimizing in the dark, tweaking campaigns against a standard they’ve never clearly defined.
And they’re not alone. Most businesses don’t have a reliable Google Ads conversion rate benchmark to measure against. They either use a generic industry average that doesn’t apply to their campaign type or rely entirely on gut feel.
Here’s what the numbers actually look like and how to benchmark the right way.
What is the Average Conversion Rate for Google Ads?
As per Wordstream, the average conversion rate for Google Ads in 2025 is 7.52%, meaning roughly 7 to 8 out of every 100 people who click your ad go on to complete a desired action, whether that’s a form fill, a phone call, a purchase, or a sign-up.
That’s the headline number. But this is where many business owners and marketers get trapped.
A 7.52% Google Ads average conversion rate sounds like a clean, usable benchmark, until you realize it’s an average across dozens of industries, multiple campaign types, and wildly different buying behaviors. Measuring your performance against it without context is like grading a surgeon and a sprinter on the same scale.
Here’s the Google AdWords conversion rate averages by industry:
| Business Category | Average CVR |
|---|---|
| Animals & Pets | 13.07% |
| Apparel / Fashion & Jewelry | 3.99% |
| Arts & Entertainment | 4.84% |
| Attorneys & Legal Services | 5.09% |
| Automotive — For Sale | 7.76% |
| Automotive — Repair, Service & Parts | 14.67% |
| Beauty & Personal Care | 7.82% |
| Business Services | 5.14% |
| Career & Employment | 4.33% |
| Dentists & Dental Services | 9.08% |
| Education & Instruction | 11.38% |
| Finance & Insurance | 2.55% |
| Furniture | 2.73% |
| Health & Fitness | 6.80% |
| Home & Home Improvement | 7.33% |
| Industrial & Commercial | 7.17% |
| Personal Services | 9.74% |
| Physicians & Surgeons | 11.62% |
| Real Estate | 3.28% |
| Restaurants & Food | 7.09% |
| Shopping, Collectibles & Gifts | 3.83% |
| Sports & Recreation | 7.62% |
| Travel | 5.75% |
Source: Wordstream
As per the table, the animals and pets category converts at around 13%, whereas the apparel and fashion industry converts at around 4%.
And, industry is just a broad factor; there are still different factors affecting the conversion rate. It is important to consider all the factors and then come up with the ideal conversion rate for that particular campaign.
Also Read: How to Calculate Conversion Rate (CRO) : Formula & Benchmark
What Else Affects Your Google Ads Conversion Rate? (Beyond Industry)
Industry is just the starting point. Two businesses in the same vertical, running the same budget, can still see completely different Google Ads conversion rates, because industry is only one piece of the equation.
Here’s what else moves the needle.
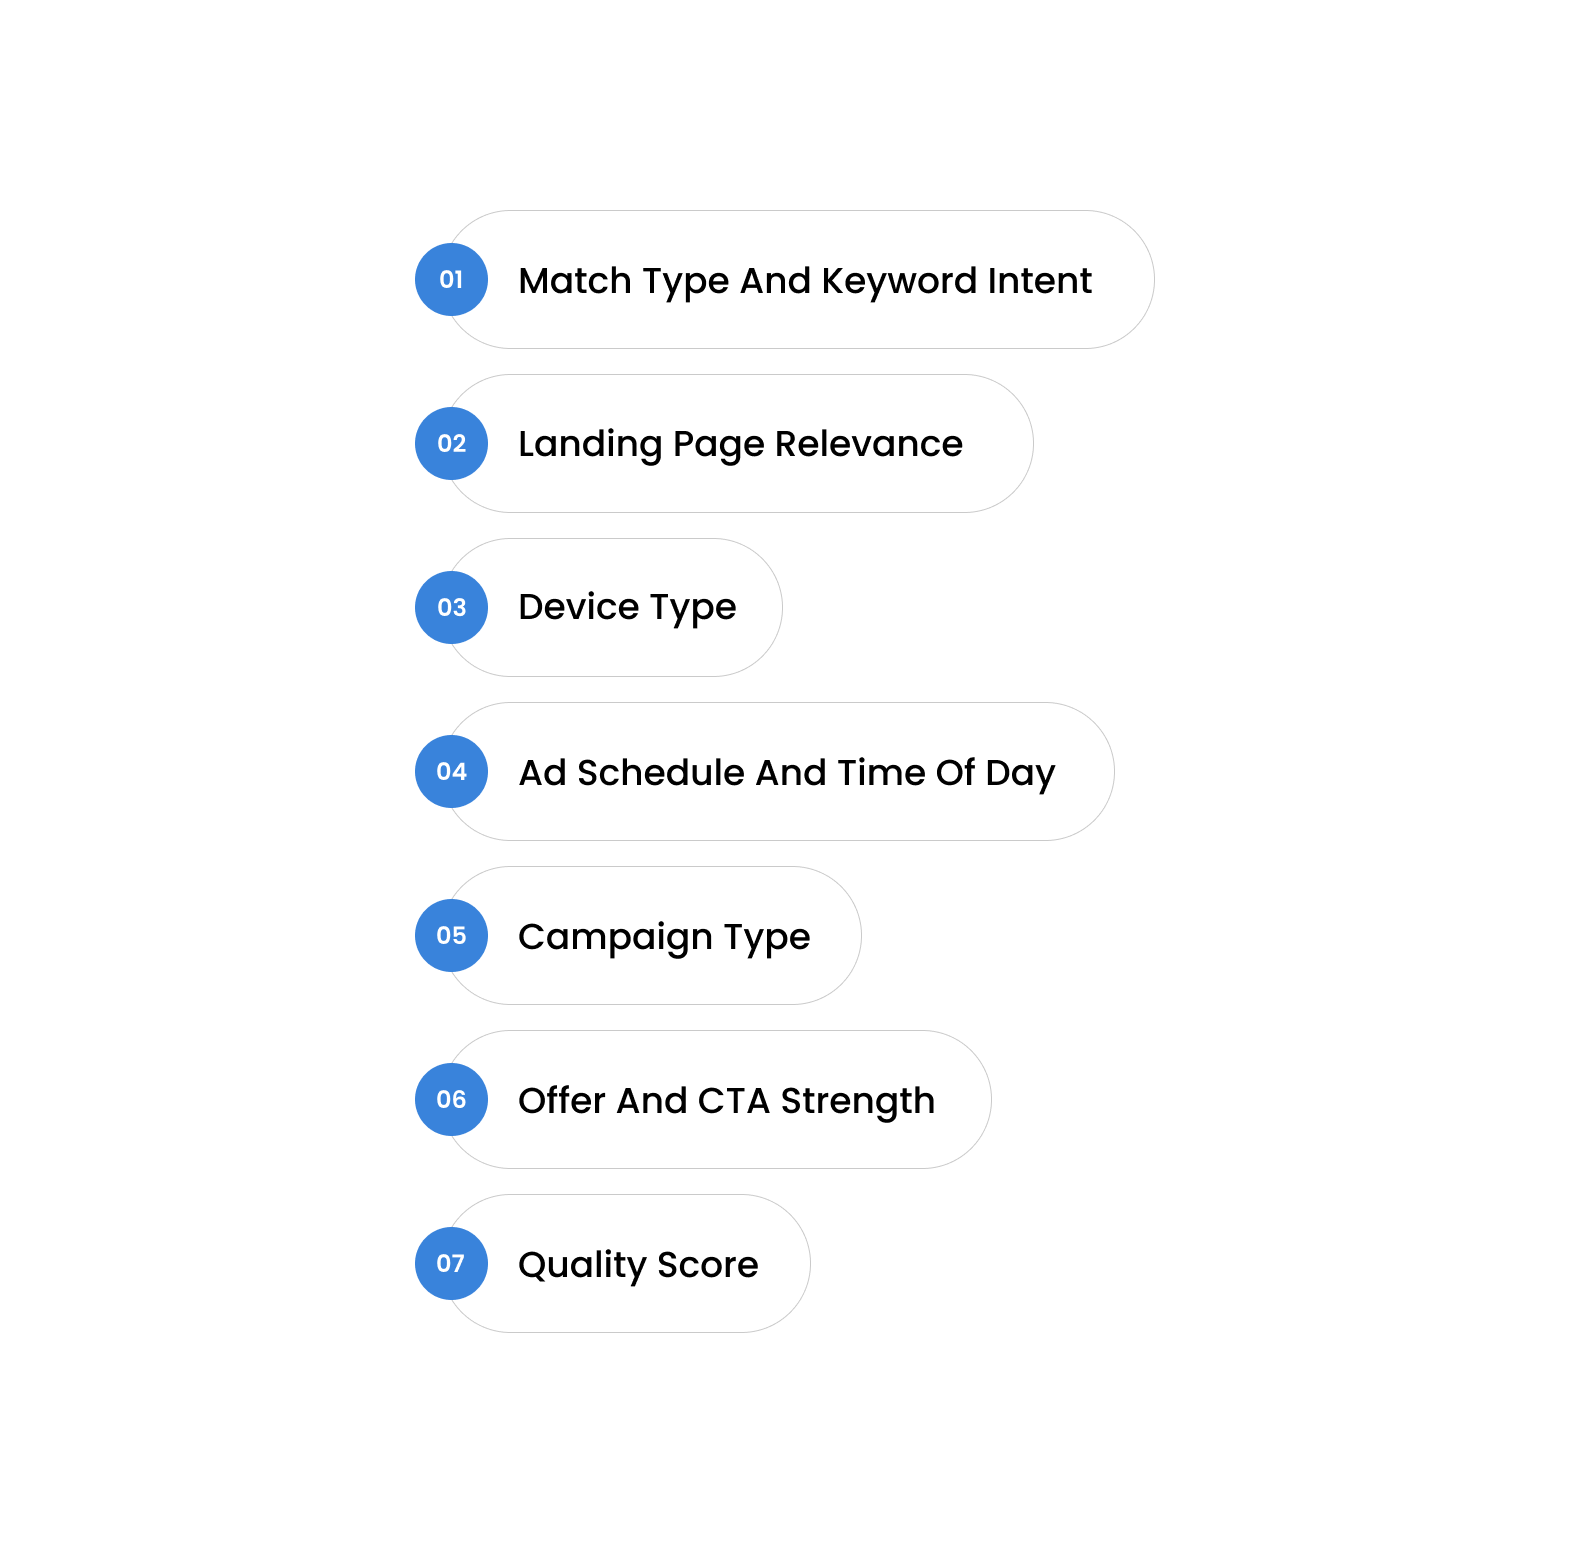
1. Match Type and Keyword Intent
Not all keywords convert equally, and the type of intent behind a search matters more than the keyword itself.
Someone searching for “best running shoes” is browsing. Someone searching “buy Nike Air Zoom size 10 mens” is ready to check out. Both might click your ad. Only one is likely to convert.
Broad match keywords cast a wider net but often pull in traffic that was never going to convert. Exact match and phrase match keywords tend to attract higher-intent searchers, which directly lifts your average conversion rate for Google Ads.
Example: A home services company switched 60% of its spend from broad to exact match keywords. Their click volume dropped by 30%, but their conversion rate nearly doubled.
2. Landing Page Relevance
Your ad gets the click. Your landing page gets the conversion. If there’s a disconnect between what the ad promises and what the page delivers, visitors leave, and your Google Ads conversion rate drops with them.
This is one of the most common reasons campaigns underperform. The ad says “Free Consultation,” and the landing page opens on the homepage with no mention of it.
Example: A law firm running ads for “personal injury lawyer” was sending traffic to their general About Us page. After building a dedicated landing page matching the ad copy exactly, their conversion rate went from 3.1% to 8.4% in six weeks.
3. Device Type
Desktop, mobile, and tablet users behave differently and convert at very different rates.
Mobile traffic has exploded, but mobile conversion rates still tend to lag behind desktop, particularly for high-consideration purchases or forms that are hard to fill out on a small screen. Mobile costs per lead are rising faster than desktop in several industries, which means if your landing page isn’t genuinely optimized for mobile, you’re paying more and converting less.
Example: An e-commerce brand noticed 65% of their clicks came from mobile, but 80% of conversions happened on desktop. A mobile checkout redesign closed that gap significantly within one quarter.
4. Ad Schedule and Time of Day
Your Google Ads average conversion rate isn’t static across the week. It shifts by day, hour, and audience behavior pattern.
A B2B software company converting at 9% on Tuesday afternoons might drop to 2% on Saturday mornings, same campaign, same budget, very different results. But, due to weekends, it will drop.
Running ads at low-conversion hours burns spend without proportional return.
Example: A dental clinic discovered 70% of their conversions happened between 8 am and 12 pm on weekdays. By concentrating their budget in those windows, they reduced wasted spend by 40% while maintaining the same lead volume.
5.Campaign Type
Search, Display, Shopping, and Performance Max campaigns carry completely different Google Ads conversion rate benchmarks, and comparing them against each other is a common mistake.
- Search campaigns typically convert the highest because the user is actively looking for something.
- Display campaigns interrupt, because they reach people who weren’t searching, so intent is lower, and conversion rates reflect that.
The average conversion rate for Google Search Ads is around 7.52%, while Display Ads average closer to 0.89%, nearly an 8x difference on the same platform.
For example, a SaaS company was averaging their Search and Display conversion rates together and thought they were sitting at 4%. When split out, Search was performing at 7.8%, actually above the benchmark, and Display was dragging the number down.
6.Offer and CTA Strength
The strength of what you’re offering and how clearly you ask for the action directly affects your average cost per conversion on Google Ads.
A weak CTA like “Learn More” will almost always underperform against “Get Your Free Quote Today” for a high-intent search. The offer needs to match where the buyer is in their journey. Top-of-funnel traffic responds to low-commitment CTAs. Bottom-of-funnel traffic responds to direct, specific offers.
Example: An insurance company changed its CTA from “Find Out More” to “Compare Quotes in 60 Seconds.” Their conversion rate increased by 34% with no changes to targeting or budget.
7.Quality Score
Google’s Quality Score, determined by expected click-through rate, ad relevance, and landing page experience, quietly shapes your conversion outcomes more than most advertisers realize.
A higher Quality Score means better ad placement at a lower cost. Better placement means more qualified eyeballs. More qualified eyeballs mean higher conversion rates. It’s a compounding effect that works in your favor or against you, depending on how well your campaign is structured.
Example: An advertiser with a Quality Score of 4 was paying $8.50 per click for a keyword, while a competitor with a Quality Score of 9 was paying $4.20 for the same keyword and ranking higher. Same auction, very different economics.
These factors don’t operate in isolation either. A high-intent keyword sending traffic to a slow, irrelevant mobile landing page will still underperform because every weak link in the chain costs you a conversion. The businesses with strong Google AdWords conversion rate averages tend to be the ones that’ve tightened every step throughout the process, not just one.
Also Read: 9 Proven Shopify CRO strategies without increasing ad spend
How to Measure the Ideal Google Ads Conversion Rate for Your Business?
There’s no single ideal Google Ads conversion rate that applies to every business. The right benchmark is built around your specific combination of industry, campaign type, ad format, audience, and location.
Let’s walk through it using one example throughout.
Sarah runs a dental clinic in Austin, Texas, spending $3,000/month on Google Ads. Her current conversion rate is 4.2%, and she has no idea if that’s good or bad.
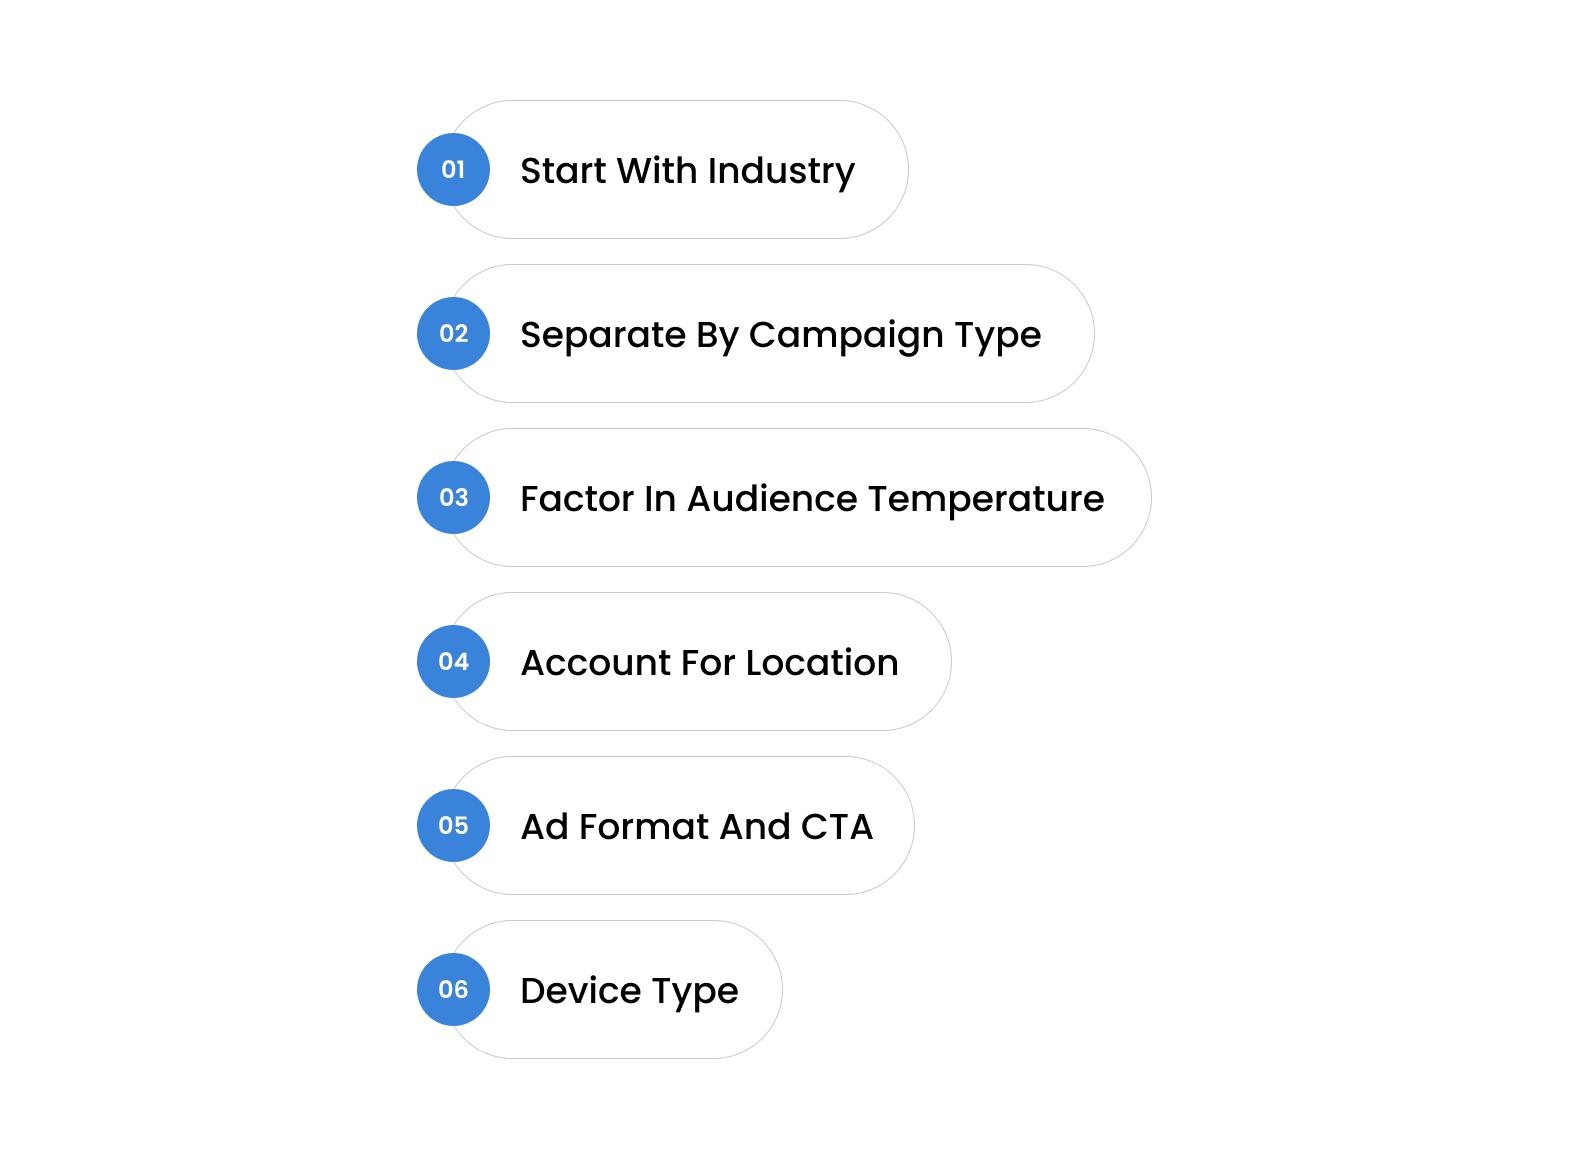
1. Start With Industry
Dental services averages 7.67% on Google Ads. That’s Sarah’s baseline, not the platform average of 7.52%. She’s underperforming her category, but how much of that is actually a problem?
2. Separate by Campaign Type
Blending Search and Display conversion rates into one number is one of the most common mistakes in Google Ads. Search converts on intent. Display converts on interruption. They should never share the same benchmark.
When Sarah splits her campaigns, her Search CVR is 6.9%, near benchmark. Her Display is 0.6%, completely normal. The blended 4.2% was masking a campaign that was actually working.
3. Factor in Audience Temperature
Remarketing audiences always convert higher than cold traffic. New visitors and past website visitors should have separate targets; treating them the same skews your entire benchmark.
Sarah’s remarketing audience converts at 14.3%. Her cold traffic sits at 5.1%. One number for both would make neither make sense.
4. Account for Location
Geography affects competition, cost, and conversion behavior. The same campaign in a dense urban market will almost always convert lower than in a less competitive suburb, simply because there are more alternatives for the searcher.
Sarah’s Austin city centre ads convert at 5.8%. Her suburban campaigns convert at 9.2%. She shifts the budget accordingly.
5. Ad Format and CTA
Not all ad formats convert equally, even within the same campaign. Call-only ads skip the landing page entirely; the click is the conversion. Responsive Search Ads depend heavily on landing page experience. And the CTA you pair with each format changes the expected conversion behavior significantly.
Sarah’s RSAs convert at 6.1% on form fills. Her call-only ads convert at 12%, not because the campaign is better, but because someone clicking a call button has already decided. Same budget, different intent signal, different benchmark.
6. Device Type
Mobile and desktop users convert at meaningfully different rates, and most businesses don’t separate them until they’re wondering where the budget went.
Sarah finds that 60% of her clicks come from mobile, but 75% of her actual bookings happen on desktop. Her mobile landing page has a three-step form that’s painful to fill out on a small screen. Once she simplifies it, her mobile CVR moves from 3.1% to 6.4%
| Layer | Factor | Adjustment |
|---|---|---|
| Industry baseline | Dental services | 7.67% |
| Campaign type | Search only | No change |
| Ad format | RSA + form fill | −0.5% |
| Audience temperature | Cold traffic | −1.5% |
| Location | Urban Austin, high competition | −1.0% |
| Device | Primarily mobile, unoptimized | −0.5% |
| The Results | Sarah’s realistic target CVR | ~4.2% – 4.7% |
Sarah’s current conversion rate of 4.2% isn’t a problem. It’s almost exactly where it should be given her campaign type, audience, location, and device split.
She wasn’t underperforming. She was just measuring herself against the wrong number.
However, with few optimizations, she can push the current CTR from 4.2% to 4.7 or 5%.
Final Thoughts
A good Google Ads conversion rate isn’t a fixed number you hit and move on from. It’s a moving target shaped by your industry, your audience, your campaigns, and the market you’re operating in.
If there’s one thing to take away from everything covered here, it’s this: stop measuring yourself against a platform average that was never built for your business. Build your own benchmark, layer by layer, and give your campaigns a standard that’s actually worth chasing.
The gap between Business A and Business B at the start of this piece? It rarely comes down to budget or luck. It comes down to knowing your numbers and knowing what to do with them.
At Enstacked, that’s the work we do every day, helping businesses cut through the noise of their Google Ads data, identify where performance is actually leaking, and build campaigns that are measured against the right standards from the start.
Frequently Asked Questions(FAQs)
Small businesses should benchmark against their specific industry rather than the platform average. A local service business converting at 5–6% on Search campaigns is performing solidly. The goal isn’t to hit 7.52%, it’s to beat your direct competitors in your specific market.
Not directly. Quality Score is determined by expected CTR, ad relevance, and landing page experience. However, a poor landing page experience which hurts conversion rate, also lowers Quality Score, which raises your cost per click. The two are connected even if they’re measured separately.
Conversion rate measures how many clicks turn into actions. Conversion value measures what those actions are worth in revenue. A campaign with a lower Google Ads conversion rate but higher average order value can outperform a high-converting campaign with low-value leads.
Depends on your goal. If you’re lead-focused, average cost per conversion on Google Ads is the more useful metric. If you’re volume-focused, conversion rate matters more. Ideally, you’re tracking both against your industry benchmark simultaneously.
Yes. If your average cost per conversion exceeds your customer lifetime value, the campaign is losing money regardless of how strong the conversion rate looks. Rate and cost always need to be read together.
Highly relevant ads attract higher-intent clicks, people who are more likely to convert because the ad matched exactly what they searched for. Poor ad relevance inflates click volume without improving conversions, which drives up cost per conversion while keeping the rate low.