
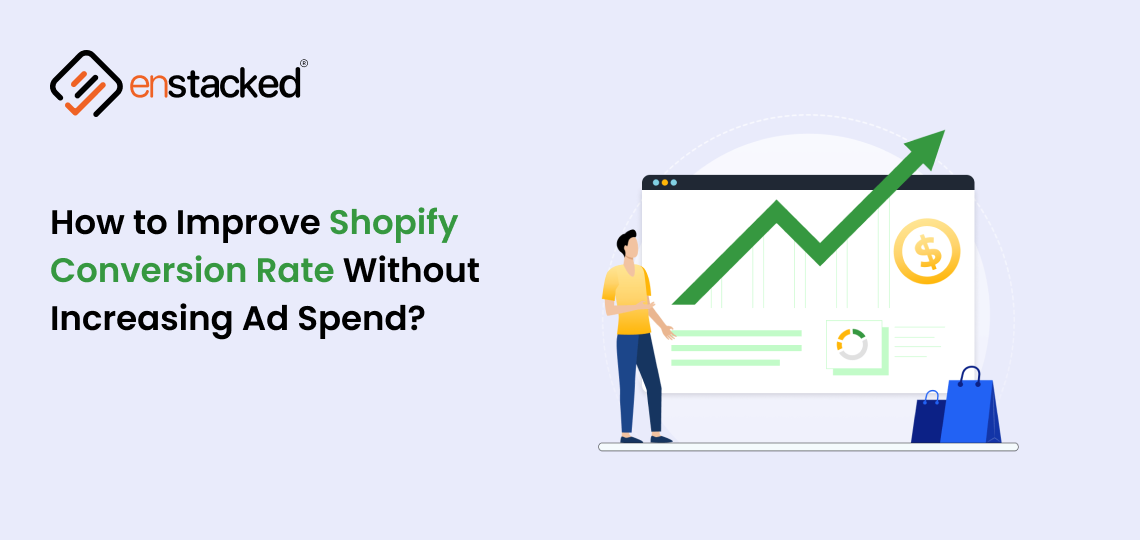
Introduction
Every e-commerce store owner watches traffic. More visitors. More clicks. More impressions. But traffic alone does not build revenue.
What actually matters is how many of those visitors turn into customers. That single number is called the conversion rate. Many brands spend thousands on ads, SEO, and social media campaigns without realizing a simple truth. If your conversion rate is weak, more traffic only means more lost opportunities.
Imagine this. Two stores receive 10,000 visitors per month.
- Store A converts at 1%
- Store B converts at 3%
Store B generates three times more sales with the same traffic. No extra ads. No extra marketing spend. Just better conversion rate optimization.
Before you spend another dollar on ads, find out what your conversion rate is actually telling you
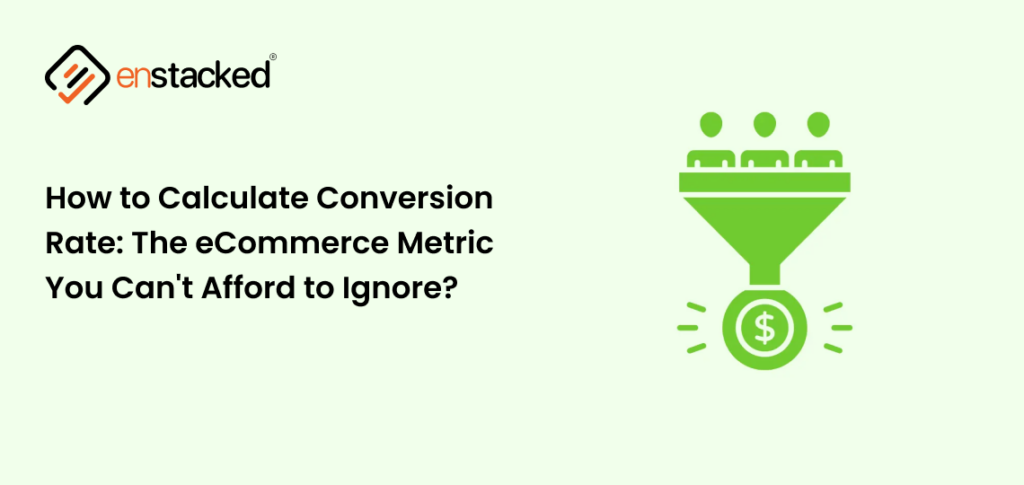
What is Conversion Rate & How Do You Calculate Conversion Rate in eCommerce?
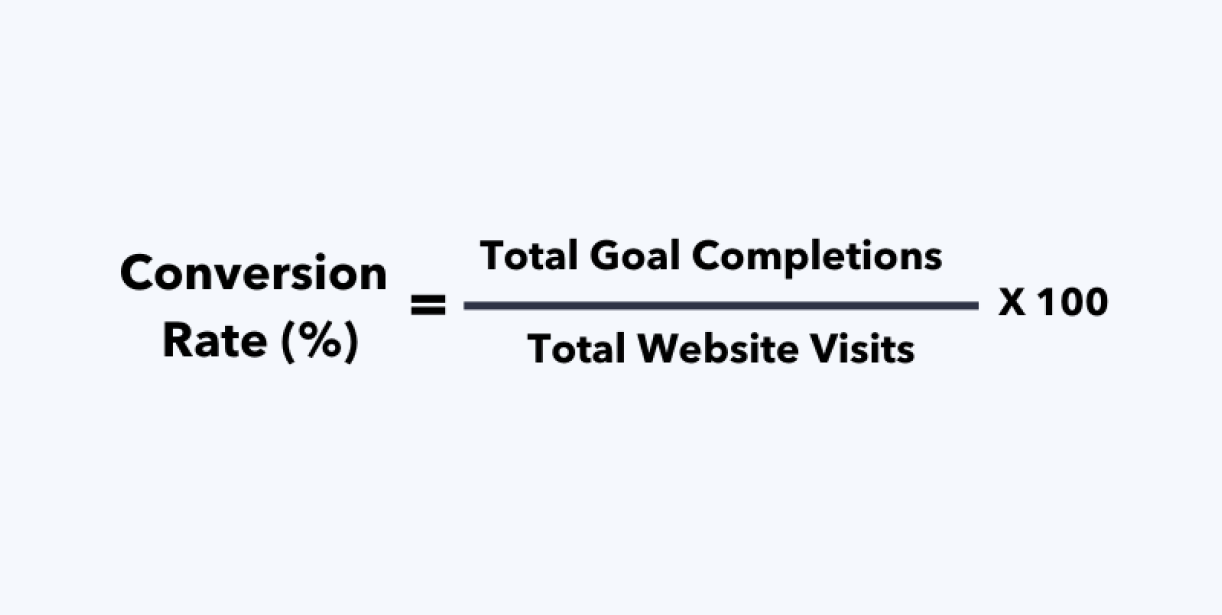
In simple terms, conversion rate measures how many visitors to your website take a desired action. In eCommerce, that action is usually a purchase, but it can also include signing up for a newsletter, adding a product to the cart, or completing a form.
The formula for how to calculate conversion rate is simple:
Conversion Rate: Conversion Rate = (Total Conversions ÷ Total Visitors) × 100
Example
- Website visitors: 5,000
- Completed purchases: 150
Conversion Rate = (150 ÷ 5000) × 100 = 3%
This means 3% of visitors converted into customers. Based on your conversion rate, you can compare it to your industry averages.
What Is the Average Conversion Rate Benchmark for eCommerce?
Understanding the average conversion rate benchmark of e-commerce becomes critical. Without a proper benchmark, it is impossible to know whether your store is performing well or quietly losing potential revenue.
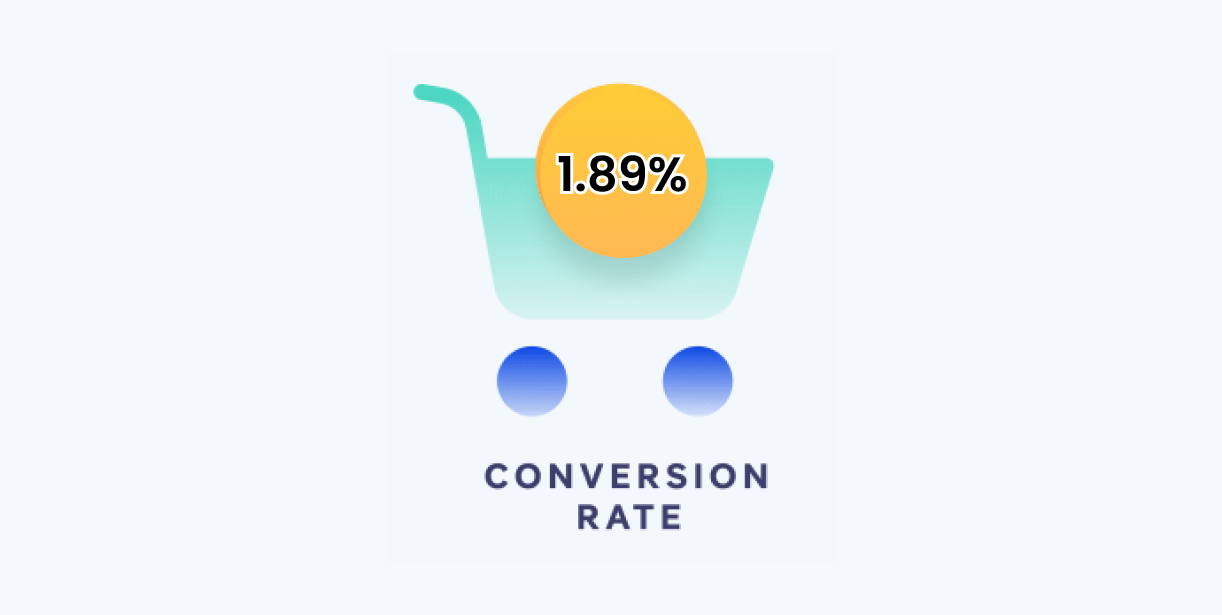
The all-industry average eCommerce conversion rate sits at approximately 1.89%.
Shopify’s own research notes that a conversion rate above 3% puts you among the best-converting online stores globally.
| Industry | Average Conversion Rate |
|---|---|
| Food & Beverage | 6.11–6.22% |
| Beauty & Personal Care | 4.55–6.8% |
| Arts & Crafts | 5.2% |
| Multi-Brand Retail | 3.81–4.9% |
| Pet Care & Veterinary | 2.50–3.41% |
| Kitchen & Home Appliances | 3.57% |
| Fashion & Apparel | 1.2–3.01% |
| Consumer Goods | 2.91% |
| Health & Wellbeing | 2.89% |
| Cars & Automotive Parts | 2.1% |
| Electronics | 1.5–2.5% |
| Home & Furniture | 1.37–1.41% |
| Luxury & Jewelry | 0.9–1% |
Source: Dynamic Yield, Convert Kart, Oberlo, Fyresit
Also,
- Desktop converts at roughly 3.9%, mobile sits at 1.8%
- Mobile accounts for the majority of e-commerce traffic
- Mobile cart abandonment runs between 79–85%, compared to desktop’s 67–70%
- Email marketing converts at up to 5.3%, and social media typically stays under 1%
- Organic search averages around 4%, paid ads sit at 2–3%
Source: Speed Commerce, Convertcart, Skailama
What a Good Conversion Rate Looks Like in Practice?
- Below 1% → Something fundamental is broken: trust signals, checkout friction, or traffic quality
- 1–2% → Underperforming for most categories; clear optimization opportunities exist
- 2–3% → At or near average; fundamentals are working, marginal gains available
- 3–4% → Strong performance; core funnel mechanics are well-optimized
- 4%+ → Top-quartile; brand, UX, and active CRO strategy are all working together
Tip before we move ahead:
- Use the benchmark to understand where you sit,
- Use funnel data, add-to-cart rate, cart-to-checkout rate, checkout completion rate to understand why
That difference separates stores that optimize intelligently from those that run endless A/B tests while a broken mobile checkout quietly loses 80% of potential customers.
Learn About What is B2B Conversion Rate Optimization?
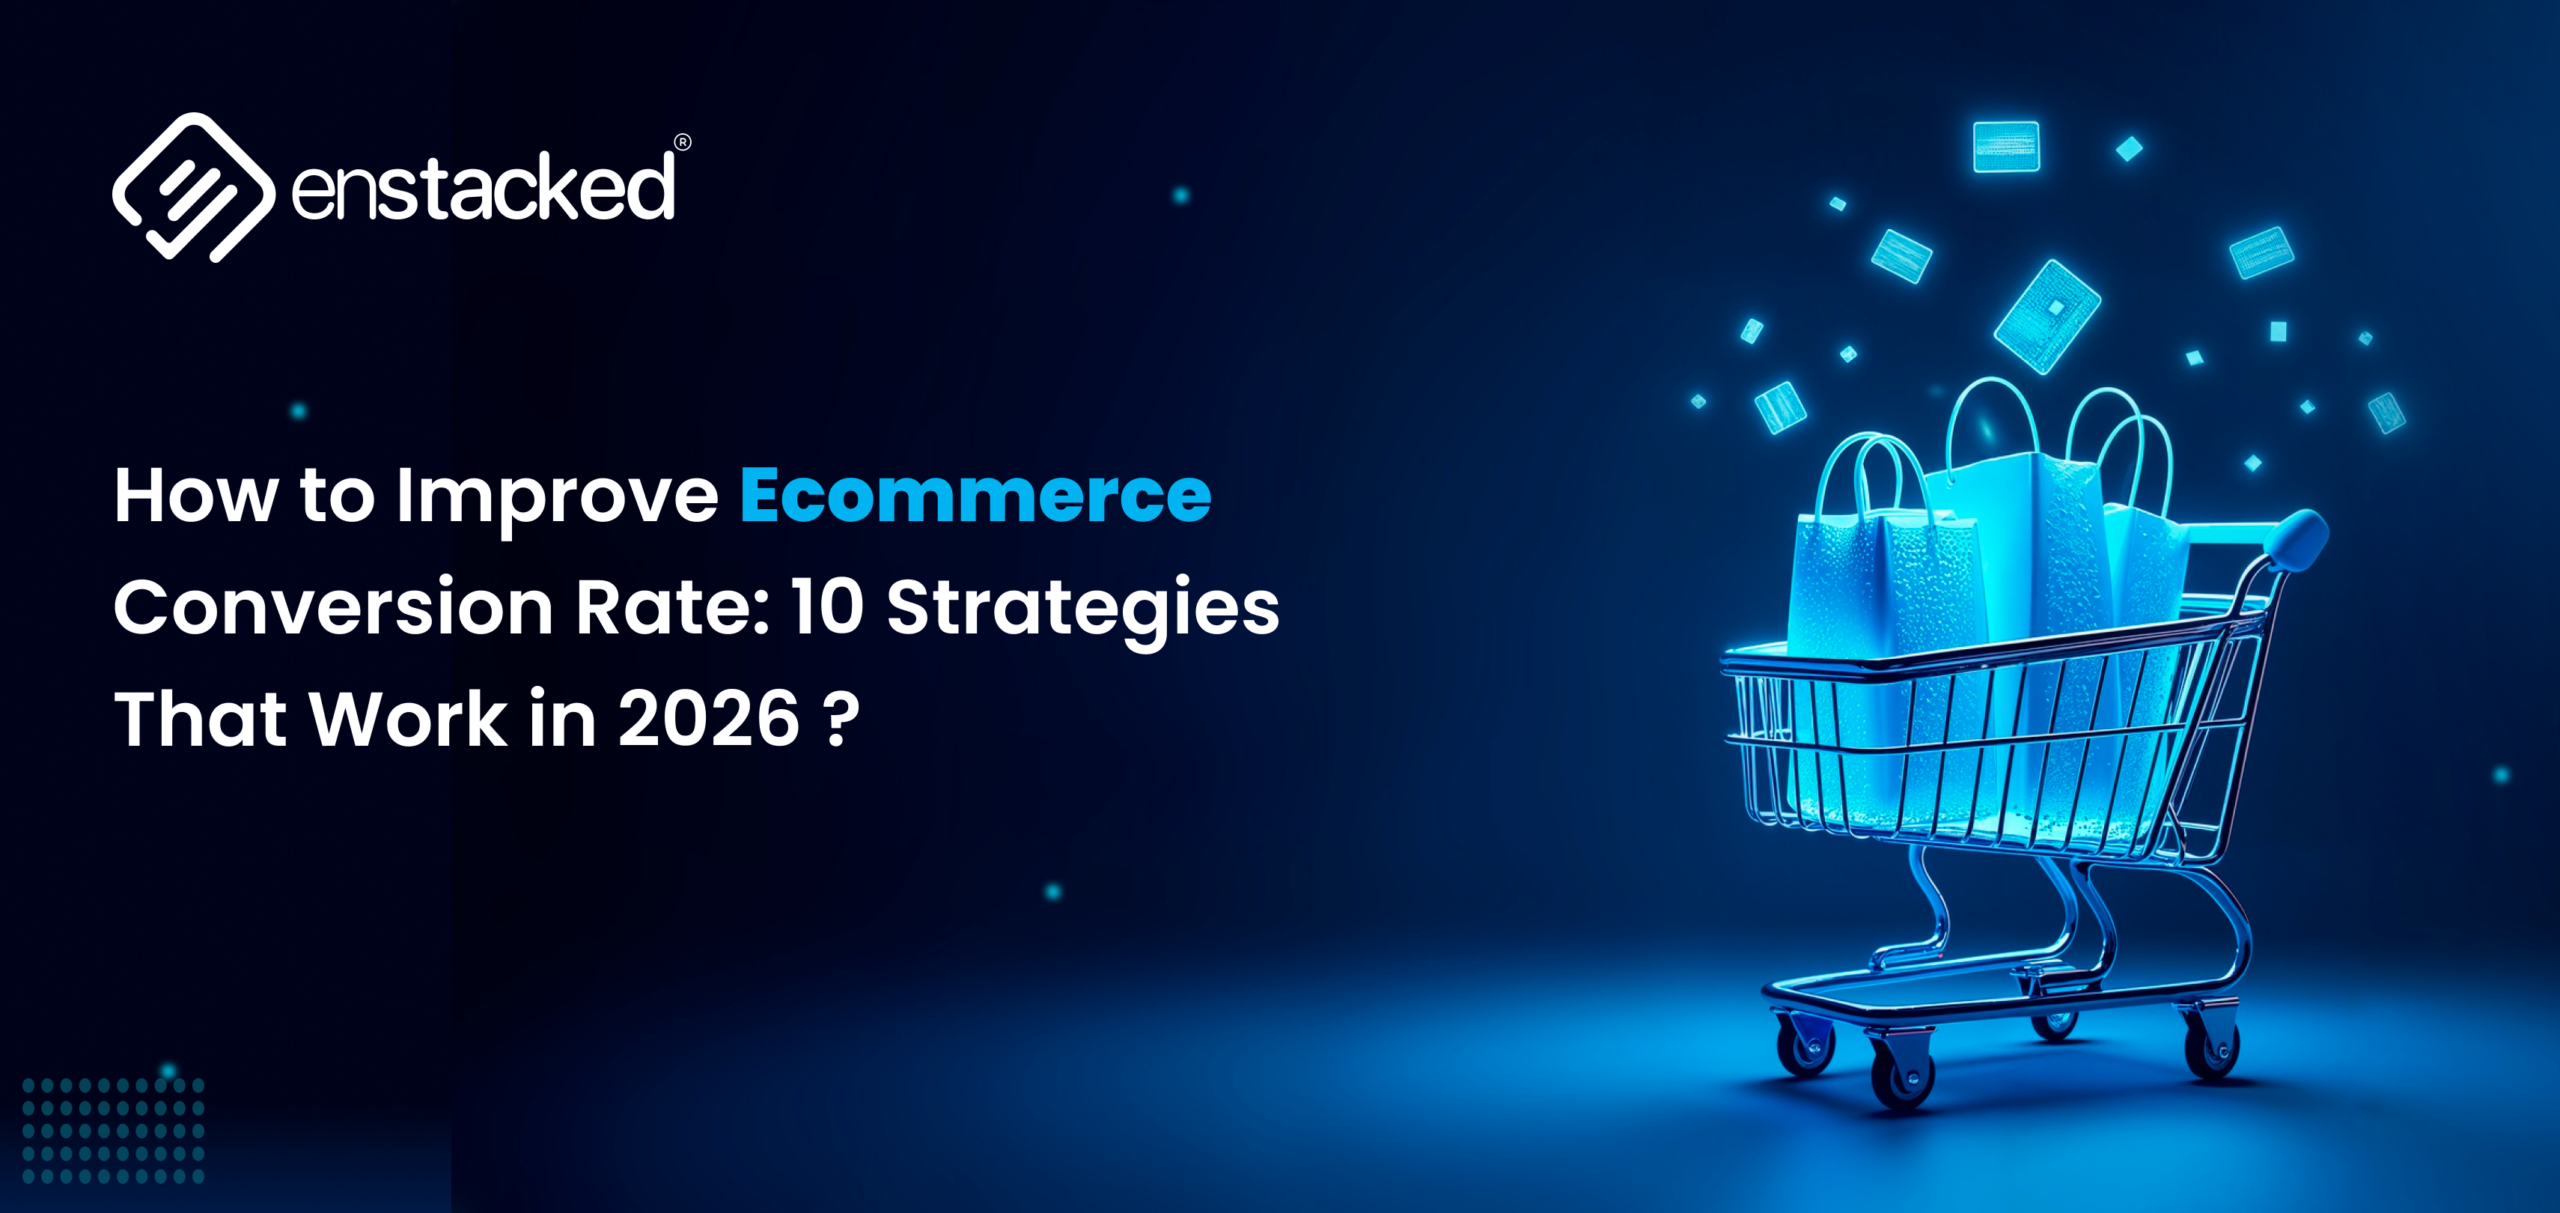
How to optimize for Conversion Rate?
The tools are only as good as the questions you ask before opening them. Start with a hypothesis. Identify where your funnel leaks, why it leaks, then pick the tool that answers that specific question.
Quantitative Tools — Find Where the Leak Is
- Google Analytics 4 — Map your funnel, identify exit pages, segment conversion by traffic source and device. Free. Non-negotiable for every store.
- Shopify Analytics — Track add-to-cart, checkout initiation, and purchase completion natively. Included in all Shopify plans.
- Mixpanel — Advanced funnel and event-level tracking for higher-traffic stores needing more granularity than GA4 provides.
Qualitative Tools — Understand Why Visitors Aren’t Converting
- Hotjar — Heatmaps, session recordings, and user feedback. Watch exactly where visitors click, scroll, rage-click, and abandon. Free plan available.
- Crazy Egg — Heatmaps that isolate hot zones capturing the most attention and cold zones that are ignored, helping you position conversion elements where they actually get seen.
- Lucky Orange — Heatmaps, session recordings, and live chat combined, so you can engage hesitant visitors in real time and understand their objections directly.
A/B Testing — Validate Before You Implement
- Optimizely — Built for high-traffic stores running complex multivariate experiments
- VWO — A/B testing, user behavior analysis, and surveys in one platform, test different site variations and gather direct visitor feedback simultaneously.
Three rules nobody follows but should:
- Never test more than one variable per page at a time
- Run tests long enough to reach statistical significance
- Always start with a hypothesis
Shopping Cart Abandonment Recovery
- Klaviyo — Automated abandonment email sequences; consistently highest ROI per dollar in eCommerce
- OptiMonk / Privy — Exit-intent popups that catch leaving visitors before they close the tab
- Shopify’s native abandoned checkout emails — Free, built-in, and massively underused
Site Speed — The CRO Factor Most Stores Overlook
- Google PageSpeed Insights / Lighthouse — Free audits of speed, Core Web Vitals, SEO, and accessibility
Learn more about 9 Proven Shopify CRO strategies without increasing ad spend
The Right Tool Stack by Store Size
| Store Stage | Core Tools |
|---|---|
| Early (under 10K visitors) | GA4, Shopify Analytics, Hotjar |
| Growing (10K–100K visitors) | GA4, Hotjar, VWO, Klaviyo |
| Scaling (100K+ visitors) | GA4, Hotjar, Optimizely, Mixpanel, Klaviyo |
Not sure which stage of your funnel is leaking or which tools make sense for where your store is right now?
That’s exactly the kind of testing Enstacked does before recommending a single optimization.
Benefits of conversion rate optimization for Ecommerce
Running traffic to a store that isn’t optimized to convert is like filling a leaking bucket. CRO fixes the bucket. Every benefit below compounds from that single idea, making what you already have work harder, smarter, and longer.
- Most stores are sitting on unconverted revenue that they don’t know exists
- Moving from 1% to 2% conversion rate on 10,000 monthly visitors means 100 extra sales, before touching a single ad
- The math compounds fast: at a $60 average order value, that’s $6,000 in monthly revenue from zero additional spend
- CRO is the only growth lever where the input (optimization) doesn’t scale linearly with the output (revenue)
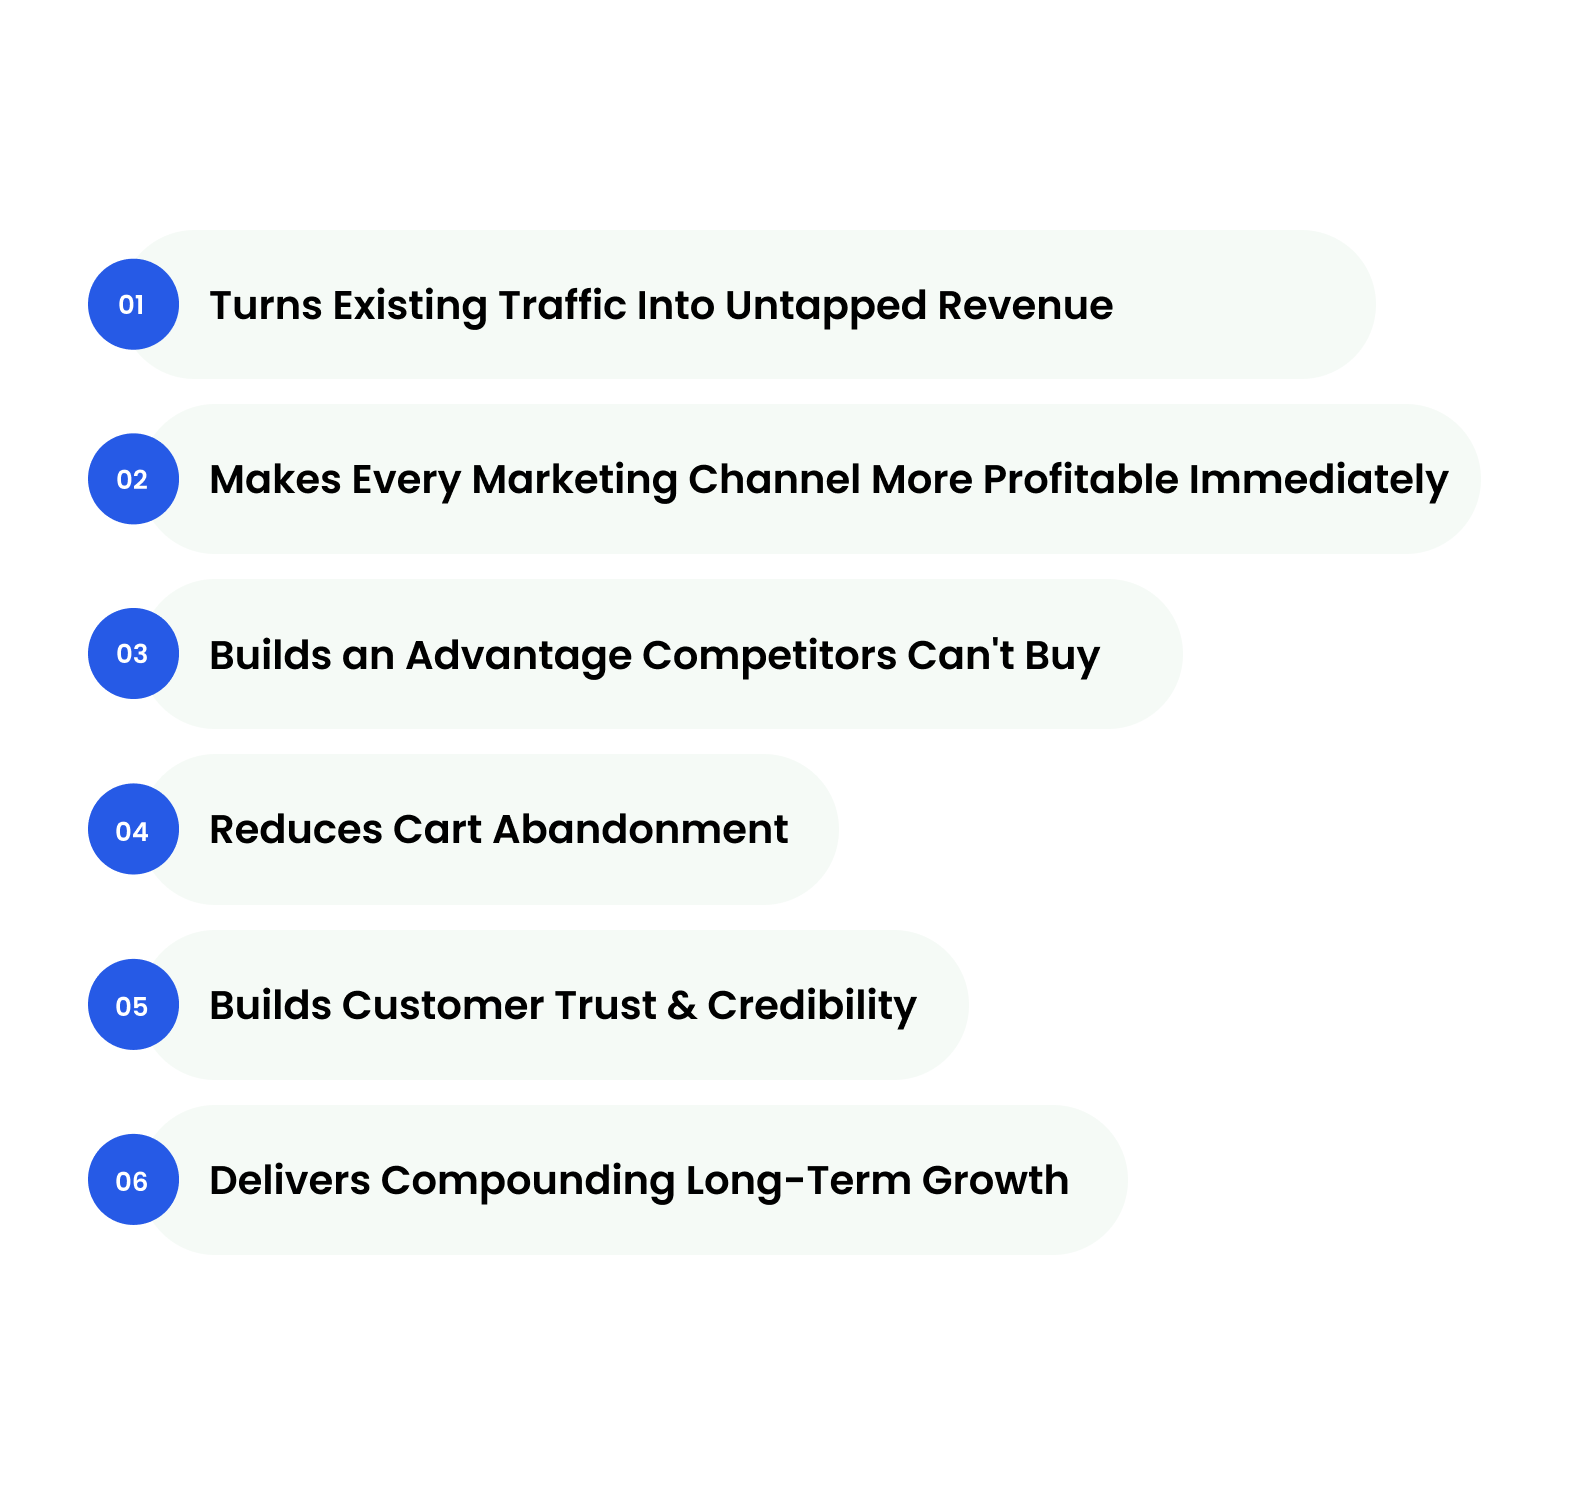
2. Makes Every Marketing Channel More Profitable Immediately
- A 1% conversion rate on Google Ads traffic means 99% of your ad spend generated no return
- Improve that to 2% and your effective Cost Per Acquisition drops by half without changing a single bid or audience
- This is why CRO should be fixed before ad budgets are scaled; scaling broken conversion is just spending more to lose more
3. Builds an Advantage Competitors Can't Buy
- Ad budgets can be matched overnight, and a competitor can outbid you by tomorrow morning
- A well-optimized funnel, built on months of testing and behavioral data, cannot be replicated quickly
- CRO compounds: each test informs the next, each fix raises the floor, and the data advantage grows wider over time.
4. Reduces Cart Abandonment
- Fewer buyers lost mid-journey through smoother checkout flows
- Removes friction points that silently kill purchase intent at the final step
- Directly recovers revenue that was already within reach
- Fixing one checkout friction point (unexpected shipping cost, forced account creation, too many steps) can recover thousands in monthly revenue that was already within reach
5. Builds Customer Trust & Credibility
- Better UX, clearer product information, and visible trust signals reduce purchase hesitation
- Confident buyers convert faster and return more often
- A well-optimized store signals professionalism before a single word is read
- CRO done right improves your brand, not just your metrics
6. Delivers Compounding Long-Term Growth
- Each optimization builds on the last; the gains don’t reset
- Data collected during CRO continuously improves future decisions
- Stores that optimize early build a structural advantage that competitors can’t easily replicate
Conclusion
Your conversion rate is never just a number. It’s a live read of how well your store is earning the trust, attention, and purchase decisions of everyone who lands on it.
By now, you know how to calculate it correctly, which benchmark actually applies to your business, and which tools and questions help you diagnose why it is where it is. That’s already more than most store owners ever do.
But knowing and doing are two different things.
CRO is an ongoing process; it requires constant monitoring, testing, and adjustment rather than a one-time fix. The stores that compound their growth aren’t the ones that read about optimization. They’re the ones who executed it into their workflows.
If you’re not sure where your conversion rate is leaking or you’ve been optimizing but the numbers aren’t moving, the problem is almost always diagnostic. You’re fixing the wrong thing.
That’s where Enstacked comes in. We work with eCommerce store owners and Shopify merchants to calculate their true conversion rate, identify exactly where buyers are dropping off, and build an optimization roadmap grounded in their actual funnel data, not generic best practices.
No guesswork. No spray-and-pray A/B testing. Just a clear picture of what’s broken and a prioritized plan to fix it.
Frequently Asked Questions(FAQs)
GA4 offers two conversion metrics:
- Session Key Event Rate (conversions ÷ total sessions)
- and User Key Event Rate (users who converted ÷ total users).
To find it: Reports → Acquisition → Traffic Acquisition → add Session Key Event Rate as a metric → filter by purchase event. Session rate shows how efficiently visits convert. User rate shows how many people eventually buy. Use both.
Yes, but it’s the multiplier, not the channel. SEO, paid ads, and social bring traffic in. CRO determines what happens after they arrive. A better conversion rate makes every other channel more profitable simultaneously. It sits at the intersection of UX, data, copywriting, and funnel strategy and is often the highest-ROI discipline in your entire digital marketing mix.
In 2025, Google Ads conversion rates dipped 9.28% overall; customers clicked more but converted less. If your rate is below 2%, the problem is rarely the ad. It’s almost always the landing page.
Start with what’s broken before adding anything new:
- Simplify to one-page checkout and offer multiple payment options
- Fix mobile experience, it’s your largest and worst-converting segment
- Display trust signals and shipping costs upfront
- Add social proof at every stage of the buyer journey, not just product pages